
About the Water Quality Monitoring Framework
The Framework has grouped together data and metadata for water quality monitoring programs in NSW on SEED. To explore datasets and programs, launch the web map viewer or visit the SEED portal.

A web application designed to display water quality programs with available data or metadata within NSW.
This group contains data assets for programs related to monitoring surface water quality in NSW. Included are a combination of government, local council and other agency-run programs.
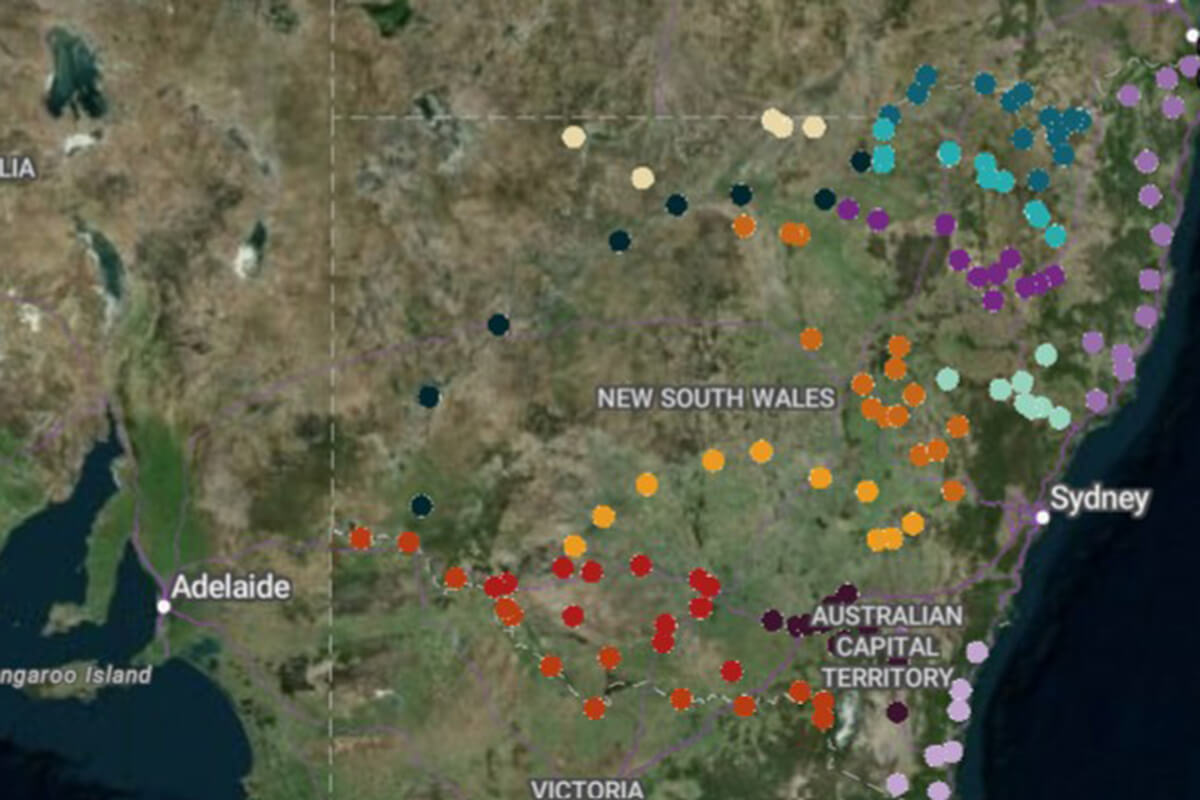
Visualise water quality conditions across NSW rivers and estuaries. This dashboard enables users to explore monitoring data collected through field sampling, identify trends, and compare water quality over time and across regions.
What the Framework provides
The Framework provides:
- guidance and governance for the organisation and sharing of state government water quality data
- direction on standards to follow in water quality monitoring data collection, management and transfer
- strategic direction on use of water quality monitoring data by state government agencies to report long-term trends in water quality, respond to water quality incidents and provide data to the public through digital platforms.
Read about the Framework in more detail below:
NSW Water Quality Dashboards and Reports

Algal alerts map displays all current alerts collated by the Regional Algal Co-ordinating Committees (RACCs) across NSW.

Access to real-time water quality data in the project area.

Provides continuous water monitoring network data. This portal pre-dates WaterNSW WaterInsights and remains an alternative platform for discovering and accessing surface water and groundwater information.
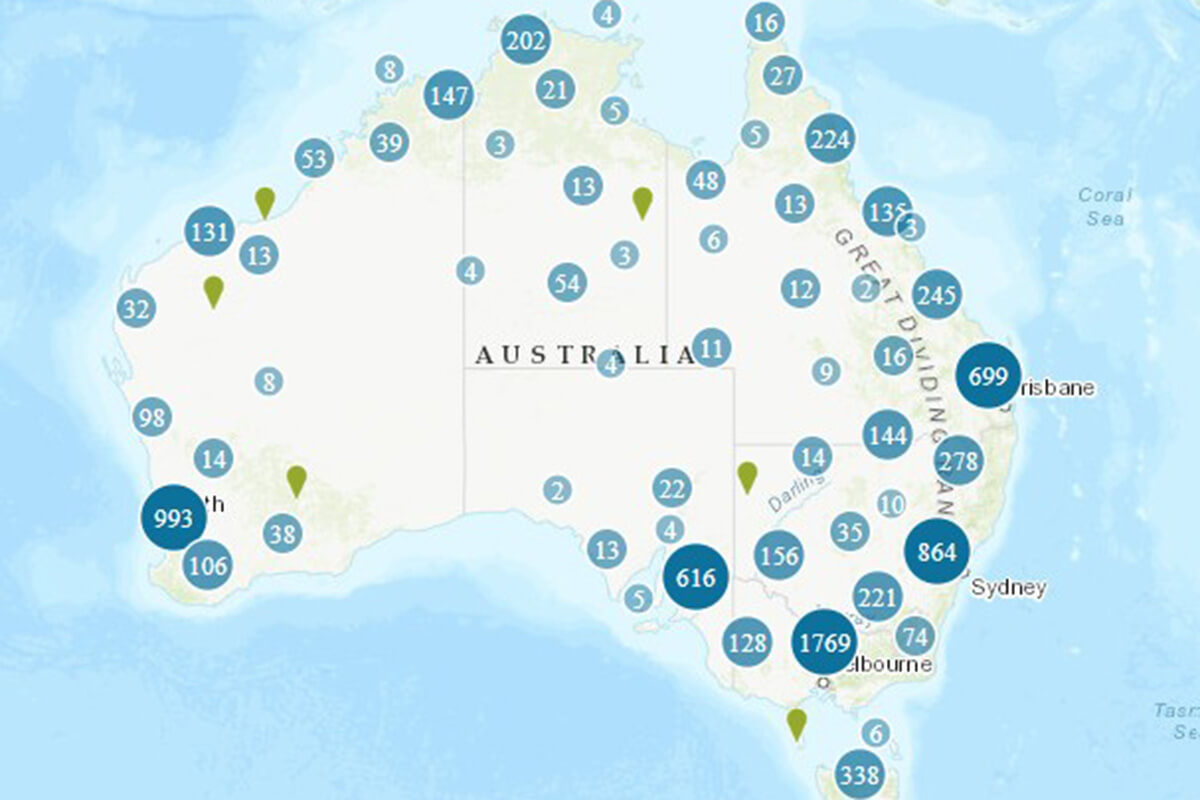
Access nationally consistent water monitoring data, including river levels and flows, with tools to view, analyse and download historical records from sites across Australia.

A national citizen science program that aims to engage communities in monitoring the health of local waterways. Data from Waterwatch can be found from this portal.

Provides an interactive view of how water is managed across NSW, including storage levels, river flows, water availability, allocations, usage and trading, with access to real-time and historical data.

Monitoring water quality for swimming in NSW. Find a monitored swim site by name, suburb, location or region from this portal.

Providing real-time environmental data for oyster farmers.

Access to real-time data along the Lower Hawkesbury estuary, between Wisemans Ferry and Broken Bay. Parameters measured: water temperature, salinity, chlorophyll-a and turbidity.

Provides water quality report cards for over 170 estuaries as part of NSW DCCEEW Science water quality monitoring program.

View surface water quality data from the Belongil and Tallows Catchments.

Explore Nepean River recreational water quality reports.

Links to real-time and manual sampling data in the Hawkesbury LGA.
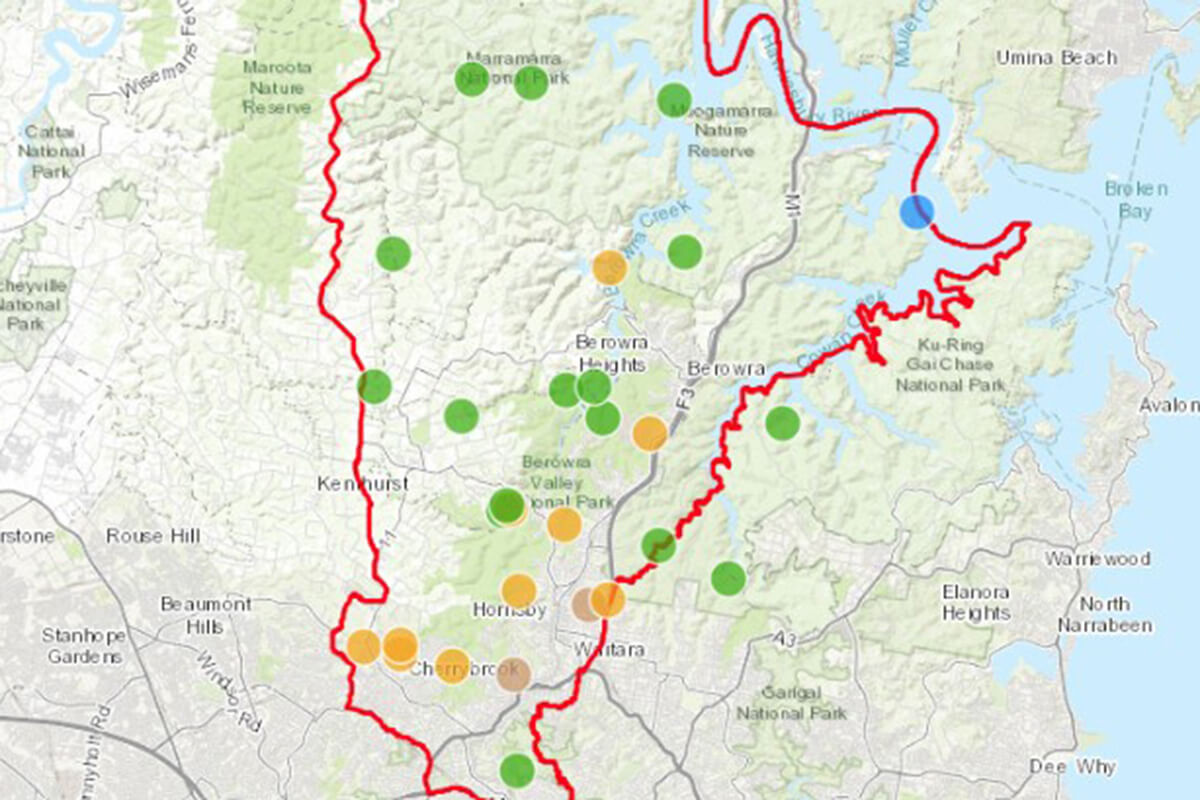
Explore local creeks and estuary grades, with links to Hornsby Shire Council Water Quality Dashboards and reports.

Explore Shoalhaven City Council Water Quality Dashboard.
Explore a range of available environmental dashboards and data visualisations on SEED.

An interactive map-based tool to discover data across coastal NSW including water quality, rainfall, waves, tides and water level.

Explore and discuss natural hazards science data. Includes an interactive map to discover environmental conditions and hazard information.
Water related data for NSW. Features portals and mapping tools to support decision making.

A web app designed to make modelling and monitoring information in the state of NSW discoverable. Locations of data available are shown on the interactive map.

Explore and discuss water data. Includes an interactive map to explore water-related spatial data information across NSW.